National Park Crowd Report 2025
How much busier is peak season? We compared every month of 2025 at the 26 US national parks with more than 1 million visits, using the National Park Service's final visitor counts.
Key findings
Most seasonal: at Acadia, an average August day drew 73.7× as many visitors as a February day (27,234 vs. 370 per day).
Busiest month anywhere: Great Smoky Mountains in October, about 50,377 visitors a day — the 7 busiest park-months of 2025 were all at Great Smoky Mountains.
Calmest peak: Death Valley — even in its busiest month (April), about 4,867 visitors a day, the lowest peak among parks with 1M+ visits.
Most even year-round: Hawaii Volcanoes — its busiest month was only 1.4× its quietest.
Shoulder season: across 30 popular parks, going in the quietest mild-weather month instead of the peak month means a median 49% fewer visitors per day; the biggest drop is at Redwood (70% fewer in February than in July).
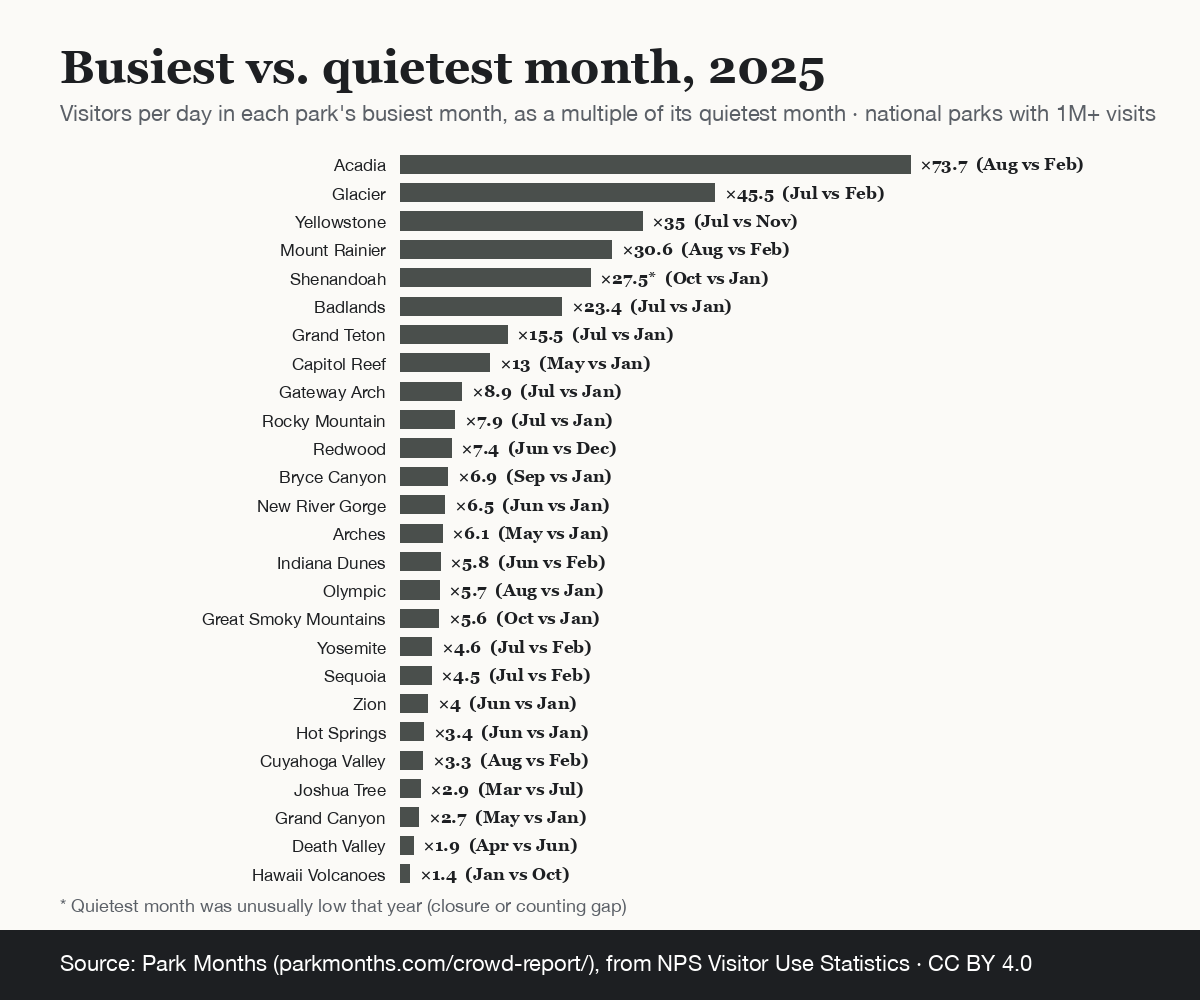
Free to use. Journalists, bloggers and researchers may republish the numbers, tables and chart on this page under CC BY 4.0 — just credit and link to this page.
Suggested credit: Source: Park Months analysis of National Park Service visitor data (parkmonths.com/crowd-report/)
Downloads: chart (PNG) · table 1 (CSV) · table 3 (CSV)
Updated once a year, after the National Park Service finalizes the previous year's counts (usually in the first quarter). Next update: early 2027, with 2026 data.
1. Busiest vs. quietest month, 2025
| Park · visits 2025 | Busiest month | Quietest month | × |
|---|---|---|---|
| Acadia4,079,318 | August27,234/day | February370/day | 73.7 |
| Glacier3,136,557 | July24,679/day | February543/day | 45.5 |
| Yellowstone4,762,988 | July31,455/day | November899/day | 35 |
| Mount Rainier1,635,342 | August13,901/day | February455/day | 30.6 |
| Shenandoah1,682,152 | October10,631/day | January *387/day | 27.5 |
| Badlands1,139,361 | July7,512/day | January321/day | 23.4 |
| Grand Teton3,800,648 | July25,393/day | January1,637/day | 15.5 |
| Capitol Reef1,388,476 | May7,135/day | January548/day | 13 |
| Gateway Arch2,209,028 | July16,004/day | January1,805/day | 8.9 |
| Rocky Mountain4,171,431 | July24,620/day | January3,116/day | 7.9 |
| Redwood1,202,480 · new count method | June7,401/day | December1,001/day | 7.4 |
| Bryce Canyon1,967,367 | September8,835/day | January1,280/day | 6.9 |
| New River Gorge1,958,440 | June8,781/day | January1,344/day | 6.5 |
| Arches1,511,740 | May6,240/day | January1,028/day | 6.1 |
| Indiana Dunes2,629,497 | June14,195/day | February2,461/day | 5.8 |
| Olympic3,584,187 | August18,237/day | January3,213/day | 5.7 |
| Great Smoky Mountains11,527,939 | October50,377/day | January8,935/day | 5.6 |
| Yosemite4,278,413 | July19,889/day | February4,307/day | 4.6 |
| Sequoia1,378,337 | July6,464/day | February1,439/day | 4.5 |
| Zion4,984,525 | June19,501/day | January4,831/day | 4 |
| Hot Springs2,494,611 | June11,719/day | January3,425/day | 3.4 |
| Cuyahoga Valley3,025,325 | August12,479/day | February3,768/day | 3.3 |
| Joshua Tree2,932,644 | March13,290/day | July4,505/day | 2.9 |
| Grand Canyon4,430,653 | May16,408/day | January6,189/day | 2.7 |
| Death Valley1,320,134 | April4,867/day | June2,539/day | 1.9 |
| Hawaii Volcanoes1,877,854 | January5,842/day | October4,040/day | 1.4 |
× = visitors per day in the busiest month divided by visitors per day in the quietest month. * The quietest month's share of the year was less than half of 2022, 2023, 2024 — usually a closure (storms, a government shutdown) or a counting gap.
2. The busiest park-months of 2025
| # | Park · month | Visitors / day |
|---|---|---|
| 1 | Great Smoky MountainsOctober 2025 · 1,561,683 visits | 50,377 |
| 2 | Great Smoky MountainsJuly 2025 · 1,435,337 visits | 46,301 |
| 3 | Great Smoky MountainsJune 2025 · 1,336,144 visits | 44,538 |
| 4 | Great Smoky MountainsMay 2025 · 1,114,160 visits | 35,941 |
| 5 | Great Smoky MountainsApril 2025 · 986,442 visits | 32,881 |
| 6 | Great Smoky MountainsSeptember 2025 · 981,366 visits | 32,712 |
| 7 | Great Smoky MountainsAugust 2025 · 998,056 visits | 32,195 |
| 8 | YellowstoneJuly 2025 · 975,109 visits | 31,455 |
| 9 | YellowstoneJune 2025 · 928,250 visits | 30,942 |
| 10 | Great Smoky MountainsNovember 2025 · 867,677 visits | 28,923 |
3. How much quieter is the shoulder season?
For 30 of the most visited and searched parks: the typical peak month vs. the quietest month with an average high of 55–85°F (months under 30% of peak are skipped as likely seasonal closures). Typical months use 2022–2025.
| Park | Peak → mild month | Fewer / day |
|---|---|---|
| Redwood | Jul → Feb5,621 → 1,700/day · high 56°F (13°C) | 70% |
| Grand Teton | Jul → Oct25,496 → 8,893/day · high 56°F (13°C) | 65% |
| Yosemite | Jul → Nov19,567 → 7,907/day · high 56°F (13°C) | 60% |
| Lassen Volcanic | Jul → Oct3,881 → 1,567/day · high 59°F (15°C) | 60% |
| Acadia | Aug → May26,395 → 10,779/day · high 64°F (18°C) | 59% |
| Rocky Mountain | Jul → May24,589 → 10,409/day · high 61°F (16°C) | 58% |
| Shenandoah | Oct → Apr10,880 → 4,548/day · high 66°F (19°C) | 58% |
| White Sands | Mar → Jan2,985 → 1,286/day · high 57°F (14°C) | 57% |
| Capitol Reef | May → Mar6,959 → 3,049/day · high 57°F (14°C) | 56% |
| Badlands | Jul → May8,054 → 3,644/day · high 72°F (22°C) | 55% |
| Arches | May → Nov6,205 → 2,827/day · high 56°F (13°C) | 54% |
| Crater Lake | Jul → Jun5,734 → 2,611/day · high 57°F (14°C) | 54% |
| Olympic | Aug → May20,203 → 9,829/day · high 63°F (17°C) | 51% |
| Zion | Jun → Nov20,182 → 10,304/day · high 64°F (18°C) | 49% |
| Big Bend | Mar → Oct3,149 → 1,595/day · high 80°F (26°C) | 49% |
| Joshua Tree | Mar → Oct12,977 → 6,726/day · high 85°F (29°C) | 48% |
| Kings Canyon | Jul → Oct4,216 → 2,192/day · high 63°F (17°C) | 48% |
| Yellowstone | Jul → May31,847 → 17,622/day · high 55°F (13°C) | 45% |
| Sequoia | Jul → Oct7,180 → 3,946/day · high 59°F (15°C) | 45% |
| Great Smoky Mountains | Oct → Mar47,229 → 25,952/day · high 59°F (15°C) | 45% |
| Mount Rainier | Jul → Sep13,273 → 7,479/day · high 57°F (14°C) | 44% |
| Saguaro | Mar → Nov4,298 → 2,404/day · high 75°F (24°C) | 44% |
| Everglades | Feb → Nov3,127 → 1,873/day · high 83°F (28°C) | 40% |
| Cuyahoga Valley | Jul → Apr13,049 → 8,053/day · high 62°F (17°C) | 38% |
| Death Valley | Mar → Jan5,109 → 3,305/day · high 67°F (20°C) | 35% |
| Bryce Canyon | Sep → Oct9,528 → 6,749/day · high 58°F (15°C) | 29% |
| Glacier | Jul → Jun24,864 → 18,620/day · high 70°F (21°C) | 25% |
| Canyonlands | May → Jun3,788 → 2,918/day · high 85°F (29°C) | 23% |
| Grand Canyon | Jul → Oct15,960 → 13,234/day · high 65°F (18°C) | 17% |
| Denali | Jul → Jun4,707 → 4,351/day · high 63°F (17°C) | 8% |
Method
- Visitor counts are NPS recreation visits, final figures for 2025 from the NPS Visitor Use Statistics. A person visiting on three days counts three times.
- “Visitors per day” = a month's visits divided by its number of days, so short months are compared fairly.
- Tables 1 and 2 use 2025 only. Table 3 uses the typical month (median share of each month in 2022–2025) and NOAA 1991–2020 weather normals; see about the data.
- Parks sometimes change how they count (Redwood in 2025); comparisons within one year are not affected.
- All figures are calculated by code from the source data; nothing is typed by hand. Park Months is independent and not affiliated with the National Park Service.
Sources: National Park Service, Visitor Use Statistics (public domain). NOAA NCEI, U.S. Climate Normals 1991–2020 (public domain). Compilation and charts © Park Months, CC BY 4.0.